Spectroscopy of Atmospherically Important Molecules
In the J Hansen lab we measure and quantify the concentration of certain atmospherically important molecules such as sulfur dioxide (SO2), hydroxy radical (OH), glyoxal (CHOCHO), and formaldehyde (CHOH). These molecules play key roles in understanding the sources and formation of ozone and particulate matter. Concentrations of these molecules are measured using broadband cavity-enhanced absorption spectroscopy (BBCEAS).

Figure 1: Structures (left to right) of SO2, OH, CHOCHO and CHOH
Broadband Cavity Enhanced Absorption Spectroscopy (BBCEAS)
Absorption spectroscopy is an analytical technique used to analyze how molecules interact with light across different wavelengths. It involves measuring the amount of light absorbed by a substance as it passes through or interacts with the molecule. By measuring the amount of light absorbed by specific wavelengths of light absorbed, absorption spectroscopy can provide valuable insights into the composition, structure, concentration, and other properties of the substance under investigation. BBCEAS can be used to measure the concentrations of multiple molecules within the same instrument with high accuracy.
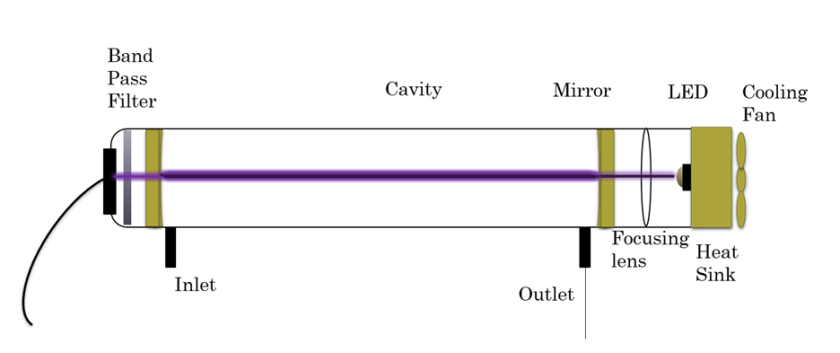
Figure 2: Basic schematic of BBCEAS cavity
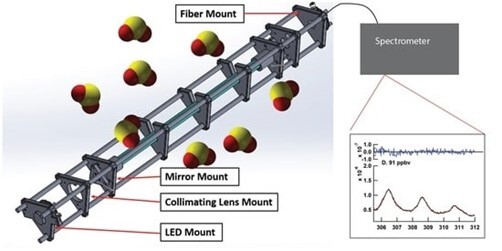
Sample air is drawn into the optical cavity through the inlet and out through the outlet via a pump. One end of the cavity contains a light emitting diode (LED) inductively cooled by a heat sink and cooling fan to keep light intensity constant. This light is focused by a lens and coupled into the cavity through the back of the first cavity mirror. Two extremely reflective mirrors (> 99.9% reflective) of specific wavelengths being measured. The light travels back and forth for up to kilometers of distance. Small amounts of light pass through the mirror opposite of the LED, through a band pass filter into a fiber and analyzed by a spectrometer. The amount of light absorbed as light travels back and forth through the cavity is used to calculate absorption of the sample air.
Data collected using the spectrometer is analyzed using the traditional BBCEAS formulae and spectral fitting of absorption cross-sections to determine the concentrations of absorbers present. The reflectivity of the mirrors in the cavity is determined using the Rayleigh scattering of ultra-pure He and N2. This is described in Equation (1), where d0 is the cavity length, ϵRay is the extinction due to Rayleigh scattering of the respective gases, and I is the spectral intensity while each gas is flowing. Equation (2) describes the calculation of the extinction coefficients using the intensity of the spectra, where ϵ(λ) is the wavelength-resolved extinction, R(λ) is the reflectivity, ϵ is the extinction due to Rayleigh scattering, I0 is the reference spectrum, and I is the measurement spectrum. The extinction coefficients were then used to solve for the concentrations of known absorbers using non-linear least-squares fitting, as seen in Equation (3)

Several papers have been published, are in review, or in the process of data collection are the following:
Detection of Sulfur Dioxide
Sulfur dioxide (SO2) is an important precursor for the formation of atmospheric sulfate aerosol and acid rain. We present an instrument using Broadband Cavity-Enhanced Absorption Spectroscopy (BBCEAS) for the measurement of SO2 with a minimum limit of detection of 0.75 ppbv (3-𝜎) using the spectral range 305.5–312 nm and an averaging time of 5 min. The instrument consists of high-reflectivity mirrors (0.9985 at 310 nm) and a deep UV light source (Light Emitting Diode). The effective absorption path length of the instrument is 610 m with a 0.966 m base length. Published reference absorption cross sections were used to fit and retrieve the SO2 concentrations and were compared to fluorescence standard measurements for SO2. The comparison was well correlated, R2 = 0.9998 with a correlation slope of 1.04. Interferences for fluorescence measurements were tested and the BBCEAS showed no interference, while ambient measurements responded similarly to standard measurement techniques.
https://doi.org/10.3390/s22072626
BBCEAS Coupled with an Interferometer for On-Band and Off-Band Detection of Glyoxal

Glyoxal (CHOCHO) is a trace gas in the atmosphere, often used as an indicator of biogenic emissions. It is frequently compared to formaldehyde concentrations, which serve as indicators of anthropogenic emissions, to gain insights into the characteristics of the environmental source. This study employed broadband cavity-enhanced absorption spectroscopy to detect gaseous CHOCHO, methylglyoxal, and NO2. Two different detection methods are compared. Spectrograph and CCD Detection: This approach involves coupling the system to a spectrograph with a charge-coupled device (CCD) detector. It achieved a 1 min 1-σ detection limit of 2.5 × 10⁸ molecules/cm3, or 10 parts per trillion (ppt). Methylglyoxal and NO2 achieved 1 min 1-σ detection limits of 34 ppt and 22 ppt, respectively. Interferometer and PMT Detection: In this method, an interferometer is used in conjunction with a photomultiplier tube (PMT) detector. It resulted in a 2 min 1-σ detection limit of 1.5 × 10¹⁰ molecules/cm3, or 600 ppt. The NO2 2 min 1-σ detection limit was determined to be 900 ppt. Concentrations of methylglyoxal were difficult to determine using this method, as they appeared to be below the detection limit of the instrument. This study discusses the advantages and limitations of each of these detection methods.
https://doi.org/10.3390/toxics12010026
Detection and Sources of Formaldehyde in Bountiful, UT
The U.S Environmental Protection Agency’s National Air Toxics Trends Stations Network has been measuring the concentration of hazardous air pollutants (HAPs) including formaldehyde (HCHO) since 2003. Bountiful, Utah (USA) has served as one of the urban monitoring sites since the network was established. Starting in 2013, the mean concentration of HCHO measured in Bountiful, Utah exceeded the non-cancer risk threshold and the 1 in 1 million cancer risk threshold. In addition, the measured concentrations were more than double those found at surrounding locations in Utah. A Positive Matrix Factorization (PMF) analysis using PMF-EPA v5 was performed using historical data (2004–2017) to better understand the sources of formaldehyde in the region. The historical data set included samples that were collected every sixth day on a 24 h basis. Beginning in February 2019 an eight-week air sampling campaign was initiated to measure formaldehyde on a two-hour averaged basis. In addition, the measurements of O3, NO, NO2, benzene, toluene, ethylbenzene, and xylenes (BTEX) were also collected. Corresponding back-trajectory wind calculations for selected time periods were calculated to aid in the understanding of the effects of BTEX emission sources and formaldehyde formation. The results indicate that the principal formaldehyde sources are associated with biomass burning and the conversion of biogenic emissions into HCHO. Back-trajectory wind analysis of low (≤3 ppbv) and high (23.8–32.5 ppbv) HCHO cases show a clear dominance of high HCHO originating in trajectories that come from the southwest and pass over the area of the oil refineries and industrial sources in the north Salt Lake City area.
https://doi.org/10.3390/atmos12030375
Detection of Glyoxal:Formaldehyde BBCEAS

Tropospheric ozone is commonly formed through the reaction of volatile organic compounds (VOCs) and nitrogen oxides (NOx, defined as the sum of NO and NO2). The VOC formaldehyde (CHOH) serves as an indicator of anthropogenic emissions, as all anthropogenic emissions pass-through CHOH as their penultimate oxidation state before oxidizing to form carbon dioxide (CO2) in the atmosphere. Similarly, glyoxal (CHOCHO), another VOC, acts as an indicator of biogenic emissions, with glyoxal being the penultimate oxidation state. These measurements, conducted at Brigham Young University (BYU), enable the identification of potential sources of volatile organic compounds (VOCs) that can be targeted by mitigation policies. Additionally, they contribute to the construction of ozone isopleths, which are 3D renderings of the O3-NOx-VOC relationship. These isopleths provide additional insights into ozone formation along the Wasatch Front.
Absorption Cross-Sections for Short Chained Alcohols
Absorption cross-sections for the 5th (6 ← 0) and 6th (7 ← 0) OH overtones for gas-phase methanol, ethanol, and isopropanol were measured using a slow flow cell and Incoherent Broadband Cavity-Enhanced Absorption Spectroscopy (IBBCEAS). Measurements were performed in two wavelength regions, 447–457 nm, and 508–518 nm, using two different instruments. The experimental results are consistent with previous computational predictions of the excitation energies for these transitions. Treating the OH stretch as a local mode allowed for calculation of the fundamental vibrational frequency (ωe), anharmonicity constant (ωexe), and the vertical dissociation energy (VDE) for each alcohol studied. The fundamental vibrational frequency is 3848 ± 18 cm−1, 3807 ± 55 cm−1, and 3813 ± 63 cm−1 for methanol, ethanol, and isopropanol, respectively. The anharmonicity constant was measured to be 84.8 ± 2.1 cm−1, 80.2 ± 5.9 cm−1, and 84.4 ± 6.8 cm−1 for methanol, ethanol, and isopropanol, respectively. The OH vertical dissociation energy was measured to be 499.4 ± 18.4 kJ/mol, 518.0 ± 56.7 kJ/mol, and 492.7 ± 59.9 kJ/mol. The spectroscopically measured values are compared to thermodynamically measured OH bond dissociation energies. The observed differences in previous measurements of the bond dissociation energies compared to the values reported herein can be explained due to the difference between vertical dissociation energies and bond dissociation energies. If the OH overtone stretching mode is excited in methanol to either the 5th or 6th overtone, the bimolecular reaction between methanol and O2 becomes thermodynamically feasible and could contribute to formation of methoxy and HO2 radical under the proper combination of pressure and temperature.